Nifty Chart of April’ 2018, Month of Top Company’s Financial Results
03-04-2018 Nifty chart Analysis
The trade war between US and China is going worst day by day. Although both the countries have started to talk on making some relief or positive construction but also ready to hike tariffs on import duty to affect the business coming to their country. Global Markets are also trading with the caution due to trade war effect.
On 5th April, RBI will announce the outcome of credit policy meeting which may not going to change any rate (rate cut) as per most of the analyst and economist expectations. Government will release Inflation Rate report on 12th April, which forecast around 5.1% increase as compared with last month’s inflation rate which was 4.44% as per tradingeconomics.com. Taking into view the technicality, monthly chart of Nifty index is making Lower High and Lower Low formation which signifies downward movement and the first major support lies at 20 months’ exponential moving average placed at 9700.
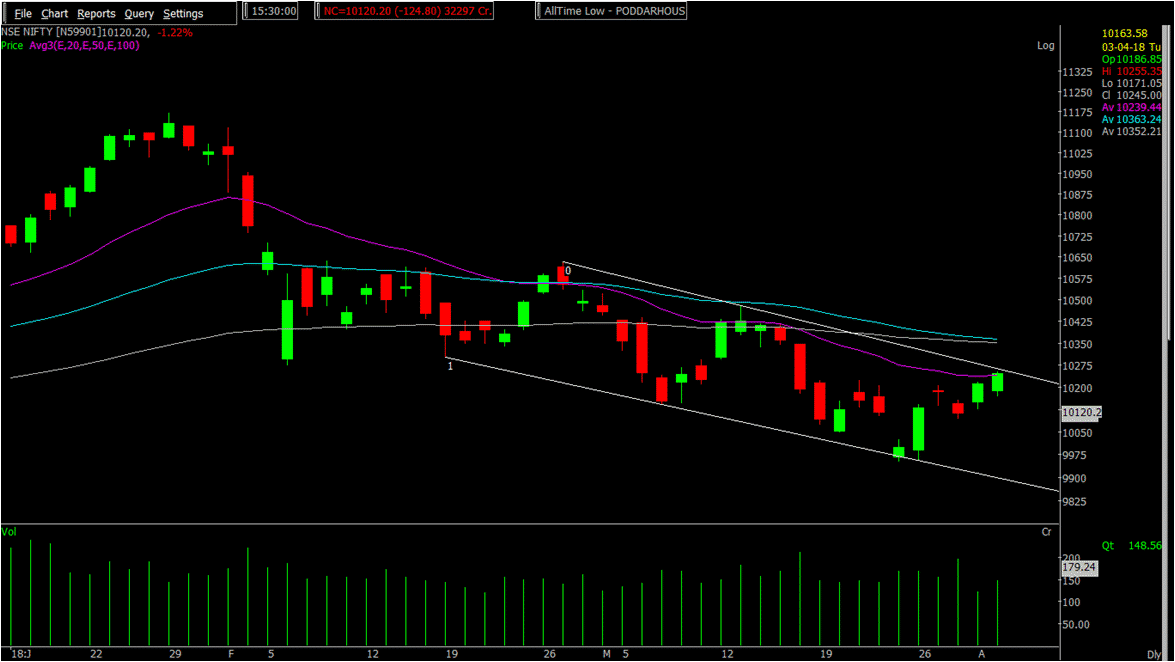
On a weekly chart of Nifty index, we have seen a bounce back move after taking support of 50 weeks exponential moving average which is around a psychological barrier level of 10000. Last week, index failed to close above the last week high so it means the trend is negative and every bounce back or upward move should be a recovery phase. On a daily chart, we can see index has been trading in a downward sloping channel with taking a resistance of 20 days exponential moving average.
For an upward journey, the index should break the upper band of the channel and move above the 100 days exponential average. The index may move towards south as long time frame chart is showing Lower High and Lower Low formation. As per the technical parameters, the resistance comes at 10300-10500 level and support comes around 9900-10000 level.